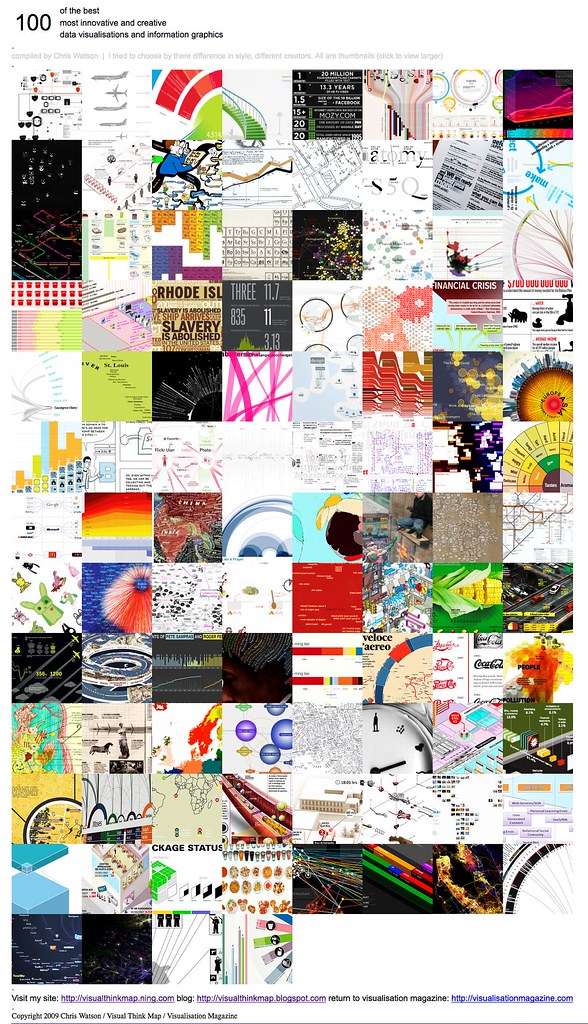
I wanted to compile a nice square thumbnailing of the different creative and innovative techniques to the visualisation of info/data. Each square is hyperlinked.
visualisationmagazine.com/100datavis.htm
Featuring:
Brian Solis (many great pieces not featured)
TeleGeography
Barrett Lyon (opte project)
Eboy
Density Design (the milan universities students work, lots of beautiful & innovative designs)
Good.is (good transparencies)
Arnaud Velten
Paula Scher
David McCandless
John Maeda (RISD professor former MIT Aesthetics & Computation)
Brian Holmes
Saatchi & Saatchi
Mozy.com
Charles Joesph Minard
Walid Raad & Triple D
Denis Wood
Information Architects (Oliver R+)
Adam Sicinksi (brilliant mindmaps, very detailed and intiricate)
Design by Vent.com
Cameron Wilde
Jess Bachman (Wall Stats.com)
Andy Proehl
Marco Quaggiotto
Boris Muller
Peter Crnokrak
Scott Mccloud
Dizzia (Visual CV)
Lauren Bugeja
Chris Watson
Quentin Delobel
Martin Wattenburg
Gerson Mora (plenty on flickr)
NB Studio
Peter Ito
Skip Vision (federer/sampras)
Ouinon.net
Zach Bean
Luca Masud
Carl Tashian
Theo Deutinger (...and associates)
Ritwik Dey
Franchesco Franchi
Dr Bollen
See Ming Lee
Dr John Snow
Moritz Stefaner
Hugh Dubberly (...and associates)
Theodore Rosendorf
Lana (crochet diagram)
Julian Beever
Nicholas Feltron
Just search a handful of those names and you will have plenty of research to feed your imagination and design techniques styles. Will probably keep adding when I get time. Oh and i know some arent strictly data vis/infographics, but we have to try and let the border between art and infographics blur and blend to promote innovation and creative growth for the fields (not that they havent already).
More great compilation sites to whet your appetite with:
http://geodata.grid.unep.ch/extras/posters.php#infographics_posters_iso_codes - geo data infographics (saw one of them on chart porn blog)
http://blogof.francescomugnai.com/2009/04/50-great-examples-of-infographics/comment-page-3/ - brilliant
http://www.webdesignerdepot.com/2009/06/25-useful-infographics-for-web-designers/ - brilliant
http://www.webdesignerdepot.com/2009/10/30-superb-examples-of-infographic-maps/
http://www.datavisualization.ch/inspiration/20-inspirational-infographics-12-%e2%80%93-19-10-09 - good collection, selections from their tumblar listed below
http://www.instantshift.com/2009/06/07/infographic-designs-overview-examples-and-best-practices/
More Galleries
WeLoveDatavis. excellant tumblr gallery from ben w at datavis.ch
Bigger Plate - is focused on providing a map sharing space for MindManager files. It offers a map library that is searchable by keyword, tags and categories. When you upload a map to share, the site automatically generates a preview image. Also, you can rate others’ maps, a feature which may help you to zero in on the most valuable maps, as judged by your peers. When you upload maps, you can designate them as password protected.
Cool Data Visualization Flickr
Density Design. MUST SEE infographics
Diagram Diaries / Flickr
GOOD magazine. infographic transparencies
Free mind share - This website bills itself as “a fast, simple way to share your FreeMind mind map(s).” After I logged in, the only option I saw was to upload and view my own maps. There doesn’t seem to be any kind of a public map gallery here. In fact, several of the capabilities of Freemindshare, including “groups” and “messages” don’t seem to be finished yet. Clicking on the links for them leads you to pages that say “This feature is not yet available"
History Shots
The Info Graphics Pool Flickr
Infografia Infographics Flickr
Infografistas.com / Infographics News Flickr
Innovation in Data Visualization Flickr
Mappio - is a repository for MindManager and FreeMind maps. Maps are searchable by title and keyword tags, and you can also view a set of featured mind maps. You can preview any map as an image file, including small, medium, large and full screen (1024×768 pixel) images that show a lot of detail. You can then decide if you want to download it as an image or as a map. Mappio also displays related maps beneath the currently selected one. The whole site is well designed and is a pleasure to browse
Nova Mind Connect - This gallery is a companion to the website of NovaMind Pty. Ltd., a leading developer of mind mapping software. NovaMind enables you to create very colorful and engaging maps, and offers its users a unique capability: They can publish their maps directly from the program to the NovaMind Connect workspace. This gallery contains the most colorful and engaging maps of any I’ve seen. If you want to see what’s possible with mind mapping software, this is the gallery that will inspire you to a higher level of visual mapping.
Scimaps
Time Visualisations. Visual History Archive - Excellant
Topic Scape. excellant mind map / diagram archive
XMIND - Like NovaMind Connect, this gallery is part of the XMIND website. You can upload your map files directly from XMIND to this shared map space.
Visual Complexity
ReMap from Bestario. excellant reorganisation of Visual Complexity
Visual Information Flickr
Apologises i know there are some very imporatant people probably not mentioned,
PLEASE COMMENT & SHARE YOUR FAVOURITES WITH A LINK TO THEIR WORK AND I WILL ADD THEM TO THE PAGE
No comments:
Post a Comment